Prices Are Rising. Blame Inflation.
With every trip to the store or browse through the fabled Amazon wish list, the higher prices remind us of the struggles that come with recent inflation.
But what is inflation? — Aside from a major pain in the wallet.
Definitions of Inflation
Merriam Webster defines inflation as “a continuing rise in the general price level usually attributed to an increase in the volume of money and credit relative to available goods and services.” The International Money Fund describes inflation a little differently, describing it as a “rate of increase in prices over a given period of time.”
While these definitions/descriptions tell us what inflation is, neither does a great job of explaining how we get inflation.
To answer that, my favorite subject — economics — has a lot to say.
Quantity Theory of Money Can Help Explain
The Quantity Theory of Money (QTM) is the simplest of these economic theories that explains how we get inflation. In short, this theory hypothesizes that changes in prices of goods and services can be explained by the changes in the supply of money in circulation. The QTM framework is useful and wields great explanatory power in its simple model. However, it does not capture everything that might affect prices and this limitation should be kept in mind.
Mathematically, the QTM can be expressed by the equation:
MV = PY
Where:
- M represents the amount of money in circulation in the economy
- V represents velocity of money, or the number of times a unit of money is used to make a transaction over a given period of time
o Similar to velocity in physics —> the distance traveled over a period of time; e.g. meters per second (m/s) in a standard textbook, or miles per hour (MPH) when we’re driving
- P represents the price level
- Y represents the total output of the economy
Within the QTM framework, the typical assumptions include the velocity of money (V) and the total output of the economy (Y) remaining constant. In this equation, M and V are the variables. However, monetary policymakers at the Federal Reserve can only change the money supply (M). The price levels (P) respond to those changes in the money supply.
The Bottom Line
The predictions of the theory and the mathematical relationship here are fairly simple: if the money supply increases, price levels will increase. The inverse applies: if the money supply decreases, price levels will decrease. For a variety of reasons, these changes will not be instantaneous but the relationship remains recognizable.
To illustrate, see this graph below from the St. Louis Federal Reserve.
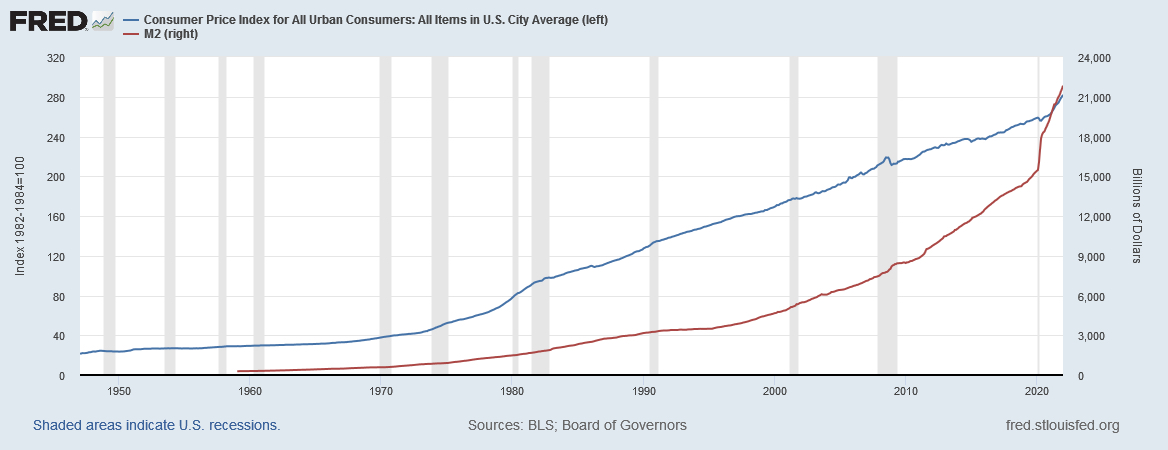
Here, the red line represents the money supply and the blue line represents the price level. Because of the timeline-framing, the recent relationship (and hardship) is difficult to see. Nonetheless, we can observe that around the start of the pandemic, the money supply sharply increased. A relatively short while after, we see price levels, as measured by the Consumer Price Index (CPI) increase significantly as well.
Likewise, we can track the relationship over the last 50+ years. The money supply is increasing throughout the timespan, and price levels rise along with it.
So, the next time you’re hearing news about inflation fears, look into changes in the money supply. The St. Louis Federal Reserve will be a good tool for assessing the validity of those predictions.
Jessi Troyan is the Director of Policy & Research for the Cardinal Institute for West Virginia Policy.